Representation of a Fiber Diffraction / Grazing Incidence pattern#
FiberIntegrator class
New parameters:
sample_orientationincident_angletilt_angle
integrate2d_grazing_incidence: method to get qIP - qOOP patternsintegrate2d_exitangles: method to get exit angles mapsintegrate2d_polar: method to get polar_angles mapsFiberIntegrator do not use pixel splitting scheme
The origin os the missing wedge
How to use pyFAI to display or reduce data from grazing-incidence/fiber scattering experiments#
import time
import numpy
import fabio
import matplotlib.pyplot as plt
from matplotlib.pyplot import subplots
from pyFAI.test.utilstest import UtilsTest
from pyFAI.gui.jupyter import display, plot1d, plot2d
from pyFAI import load, version as pyFAI_version
from pyFAI.integrator.fiber import FiberIntegrator
from pyFAI.units import get_unit_fiber
from pyFAI.integrator.azimuthal import AzimuthalIntegrator
from pyFAI.io.ponifile import PoniFile

y6 = fabio.open(UtilsTest.getimage("Y6.edf")).data
air = fabio.open(UtilsTest.getimage("air.edf")).data
data = y6 - 0.03 * air
def update_style(ax):
    for img in ax.get_images():
        img.set_cmap("viridis")
        img.set_clim(10,500)
t0 = time.perf_counter()
print("pyFAI version:", pyFAI_version)
WARNING:silx.opencl.common:The module pyOpenCL has been imported but can't be used here
pyFAI version: 2026.1.0-dev0
Since version 2025.01, pyFAI uses a specific Integrator for this case: FiberIntegrator#
The FiberIntegrator can be created by three ways:
Using
pyFAI.loaddeclaring thepyFAI.integrator.fiber.FiberIntegratorastype_Importing and instantiating directly a
pyFAI.integrator.fiber.FiberIntegratorPromoting an
AzimuthalIntegratorinstance usingpromote
poni_filename = UtilsTest.getimage("LaB6_3.poni")
# 1st way
fi = load(filename=poni_filename, type_="pyFAI.integrator.fiber.FiberIntegrator")

# 2nd way
poni = PoniFile(data=poni_filename)
fi = FiberIntegrator(dist=poni.dist, poni1=poni.poni1, poni2=poni.poni2,
                     wavelength=poni.wavelength,
                     rot1=poni.rot1, rot2=poni.rot2, rot3=poni.rot3,
                     detector=poni.detector,
                    )

# 3rd way
ai = load(filename=poni_filename)
fi = ai.promote(type_="pyFAI.integrator.fiber.FiberIntegrator")
#
FiberIntegrator#
FiberIntegrator API provides two main integration methods#
integrate2d_grazing_incidence == integrate2d_fiber
integrate1d_grazing_incidence == integrate1d_fiber
The methods accept the following arguments:#
npt_oop: Number of bins in the out-of-plane direction.unit_oop: Unit to be used as out-of-plane. By default:qoop_nm^-1oop_range: Range of integratin along the out-of-plane axisnpt_ip: Number of bins in the in-plane directionunit_ip: Unit to be used as in-plane. By default:qip_nm^-1ip_range: Range of integratin along the in-plane axisincident_angle: tilting of the sample towards the beam (analog to rot2) (rads)tilt_angle: tilting of the sample orthogonal to the beam direction (analog to rot3) (rads)sample_orientation: 1-8, orientation of the fiber axis according to EXIF orientation values
Only for integrate1d methods:
vertical_integration: If True, integrates along unit_ip; if False, integrates along unit_oop
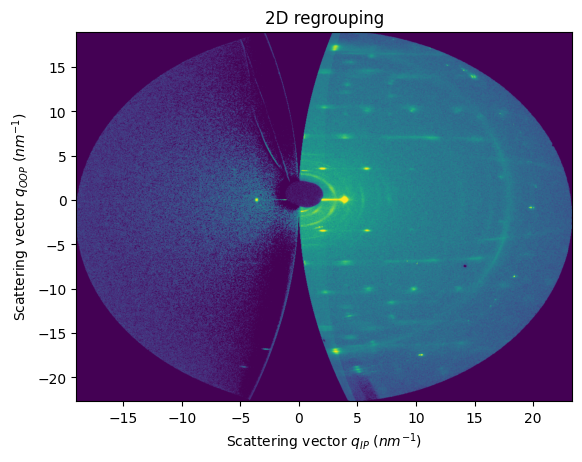
integrate2d_grazing_incidence by default remaps a diffraction pattern into $q_{IP} (nm^{-1})$ vs $q_{OOP}(nm^{-1})$#
res2d_default = fi.integrate2d_grazing_incidence(data=data)
fig, ax = subplots()
plot2d(result=res2d_default, ax=ax)
update_style(ax=ax)
pass
The orientation of the axis can bet set with the parameter: sample_orientation#
There are 8 possible orientations (1 -> 8). Default value = 1
fig, axes = subplots(ncols=4, nrows=2, figsize=(12,6))
results_so = []
for sample_orientation in range(1,9):
    res = fi.integrate2d_grazing_incidence(data=data, sample_orientation=sample_orientation)
    ax = axes.ravel()[sample_orientation - 1]
    plot2d(result=res, ax=ax)
    update_style(ax=ax)
    ax.set_title(f"SO: {sample_orientation}")
    ax.set_xlabel("")
    ax.set_ylabel("")
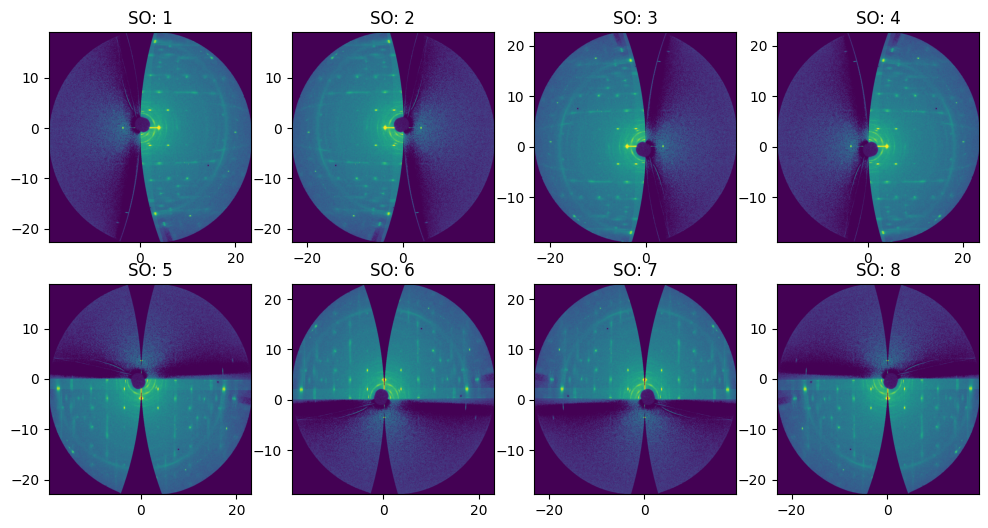
For this sample, due to a 90 degrees rotation of the detector, the correct sample_orientation is 6 or 7 (mirrored images)#
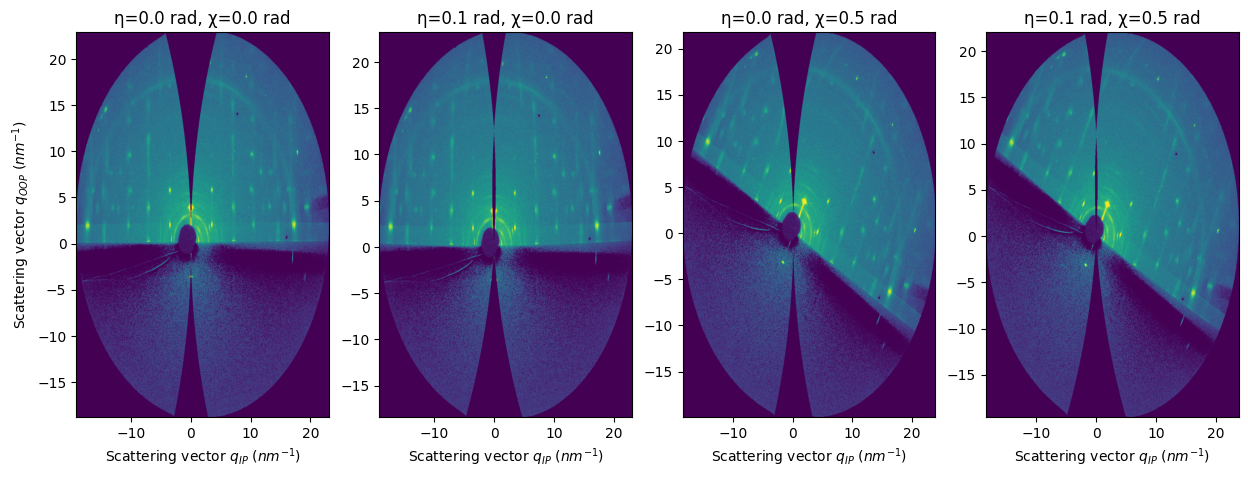
FiberIntegrator introduces three new parameters:#
sample_orientation (int) : default = 1
incident_angle (η) (float) : default=0.0 (in radians). Tilt of the sample stage towards the beam (key parameter in grazing-incidence)
tilt_angle (χ) (float) : default=0.0 (in radians). Horizon tilt of the sample stage (normally as close as 0.0 in grazing-incidence)
res_0 = fi.integrate2d_grazing_incidence(data=data, sample_orientation=6, incident_angle=0.0, tilt_angle=0.0)
res_1 = fi.integrate2d_grazing_incidence(data=data, sample_orientation=6, incident_angle=0.1, tilt_angle=0.0)
res_2 = fi.integrate2d_grazing_incidence(data=data, sample_orientation=6, incident_angle=0.0, tilt_angle=0.5)
res_3 = fi.integrate2d_grazing_incidence(data=data, sample_orientation=6, incident_angle=0.1, tilt_angle=0.5)
iangles = (0.0, 0.1, 0.0, 0.1)
tangles = (0.0, 0.0, 0.5, 0.5)
fig, axes = subplots(ncols=4, figsize=(15,5))
for iangle, tangle, ax, res in zip(iangles, tangles, axes.ravel(), [res_0, res_1, res_2, res_3]):
    plot2d(result=res, ax=ax)
    update_style(ax=ax)
    if ax != axes[0]:
        ax.set_ylabel("")
    ax.set_title(f"η={iangle} rad, χ={tangle} rad")
Angles can be set in degrees with use_degrees#
res_4 = fi.integrate2d_grazing_incidence(data=data, sample_orientation=6, incident_angle=0.12, tilt_angle=0.2, angle_unit="deg")
res_4.ip_unit
qip_nm^-1
Incident angle=0.12° (0.002 rads)
Tilt angle=0.20° (0.003 rads)
Sample orientation=6
res_4.oop_unit
qoop_nm^-1
Incident angle=0.12° (0.002 rads)
Tilt angle=0.20° (0.003 rads)
Sample orientation=6
Otherwise, remember that the default units are radians!#
res_4 = fi.integrate2d_grazing_incidence(data=data, sample_orientation=6, incident_angle=0.12, tilt_angle=0.2)
res_4.ip_unit
qip_nm^-1
Incident angle=6.88° (0.120 rads)
Tilt angle=11.46° (0.200 rads)
Sample orientation=6
res_4.oop_unit
qoop_nm^-1
Incident angle=6.88° (0.120 rads)
Tilt angle=11.46° (0.200 rads)
Sample orientation=6
Effects:#
incident_anglechanges the accessible region along the out-of-plane axis (just like in a reflectivity experiment)tilt_anglerotates the pattern around the direct beam point (q=0nm-1)
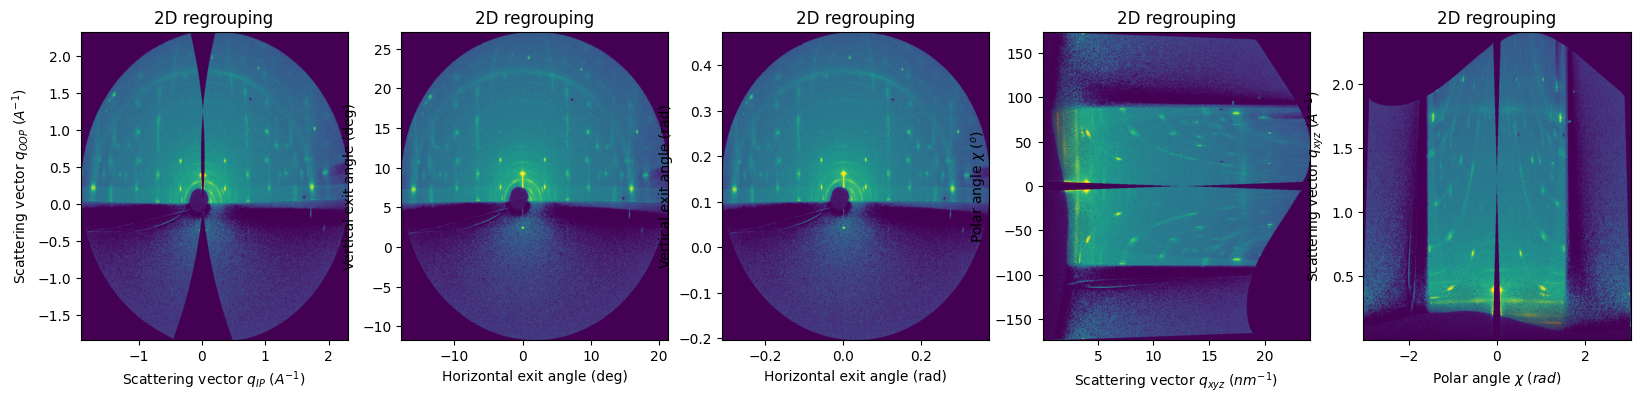
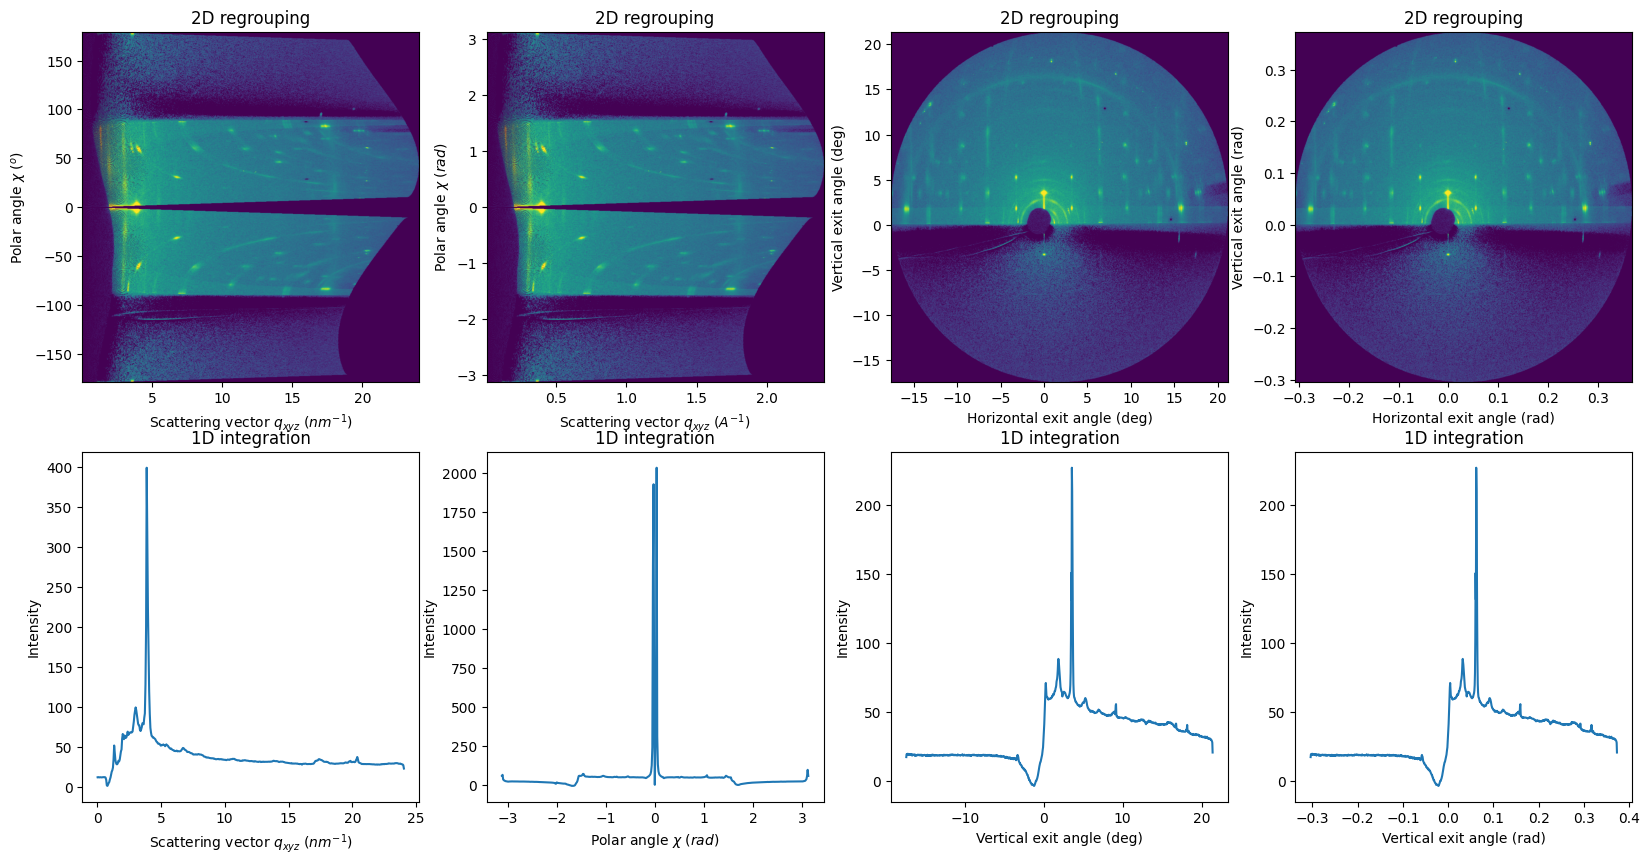
pyFAI provides methods for other fiber units#
integrate_2d_grazing_incidenceuses by default qIP_nm^-1 and qOOP_nm^-1 (switchable to A^-1 units)integrate2d_exitanglesfor horizontal and vertical exit angles in which the origin is the sample horizon (dependent ofincident_angle)integrate2d_polarto represent the polar angles (as the arctan of qOOP / qIP) versus q modulus
iangle = 0.1
res_0 = fi.integrate2d_grazing_incidence(data=data,
                                         unit_ip="qip_A^-1", unit_oop="qoop_A^-1",
                                         sample_orientation=6, incident_angle=iangle,
                                         )
res_1 = fi.integrate2d_exitangles(data=data, sample_orientation=6, incident_angle=iangle)
res_2 = fi.integrate2d_exitangles(data=data, sample_orientation=6, incident_angle=iangle,
                                  angle_degrees=False,
                                 )
res_3 = fi.integrate2d_polar(data=data, sample_orientation=6, incident_angle=iangle)
res_4 = fi.integrate2d_polar(data=data, sample_orientation=6, incident_angle=iangle,
                             polar_degrees=False,
                             radial_unit="A^-1", rotate=True)

fig, axes = subplots(ncols=5, figsize=(20,4))
for ax, res in zip(axes.ravel(), [res_0, res_1, res_2, res_3, res_4]):
    plot2d(result=res, ax=ax)
    update_style(ax=ax)
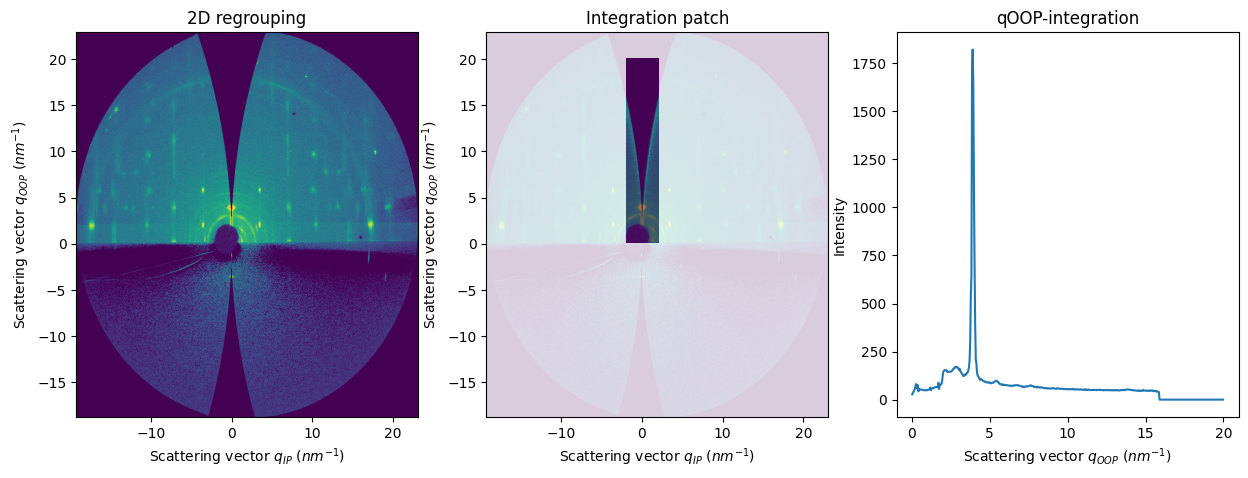
integrate1d_grazing_incidence#
This method slice regions of integrate2d_grazing_incidence maps (essentially, integrate1d using the new Fiber Units)
Additional parameter to consider:
vertical_integration: default = True
res2d = fi.integrate2d_grazing_incidence(data=data, sample_orientation=6, incident_angle=numpy.deg2rad(0.12))
res2d_patch = fi.integrate2d_grazing_incidence(data=data, sample_orientation=6, incident_angle=numpy.deg2rad(0.12),
                                               npt_ip=500, npt_oop=500,
                                               ip_range=(-2,2), oop_range=(0,20))

res1d_vertical = fi.integrate1d_grazing_incidence(data=data, sample_orientation=6, incident_angle=numpy.deg2rad(0.12),
                                                  npt_ip=500, npt_oop=500,
                                                  ip_range=(-2,2), oop_range=(0,20))

fig, axes = subplots(ncols=3, figsize=(15,5))
plot2d(result=res2d, ax=axes[0])
plot2d(result=res2d_patch, ax=axes[1])
plot2d(result=res2d, ax=axes[1])
update_style(ax=axes[0])
update_style(ax=axes[1])
axes[1].get_images()[1].set_alpha(0.2)
plot1d(result=res1d_vertical, ax=axes[2])
axes[1].set_title("Integration patch")
axes[2].set_title("qOOP-integration");
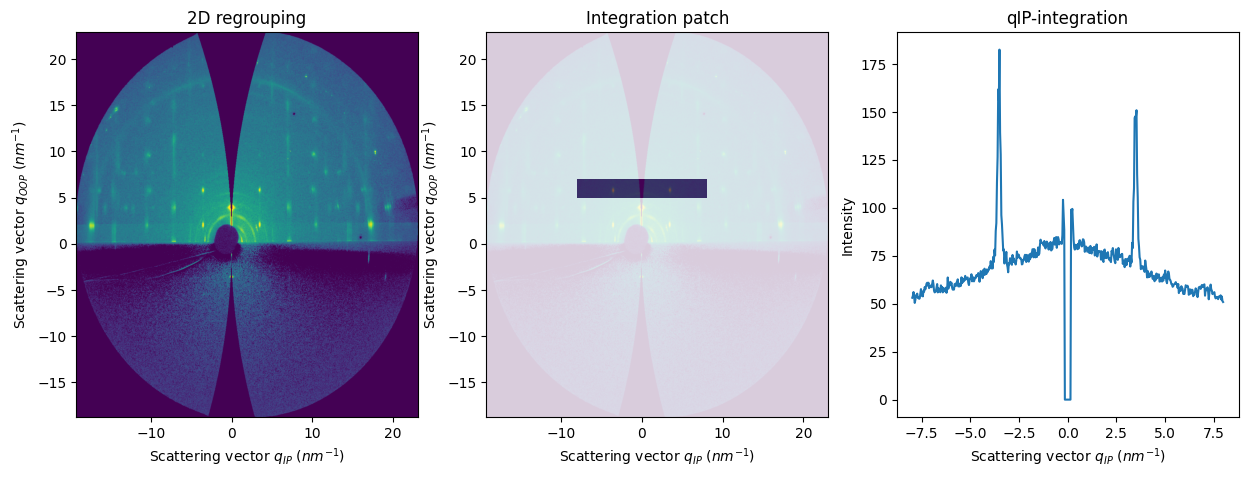
res2d = fi.integrate2d_grazing_incidence(data=data, sample_orientation=6, incident_angle=numpy.deg2rad(0.12))
res2d_patch = fi.integrate2d_grazing_incidence(data=data, sample_orientation=6, incident_angle=numpy.deg2rad(0.12),
                                               npt_ip=500, npt_oop=500,
                                               ip_range=(-8,8), oop_range=(5,7))

res1d_horizontal = fi.integrate1d_grazing_incidence(data=data, sample_orientation=6, incident_angle=numpy.deg2rad(0.12),
                                                  npt_ip=500, npt_oop=500,
                                                  ip_range=(-8,8), oop_range=(5,7),
                                                    vertical_integration=False,
                                                   )

fig, axes = subplots(ncols=3, figsize=(15,5))
plot2d(result=res2d, ax=axes[0])
plot2d(result=res2d_patch, ax=axes[1])
plot2d(result=res2d, ax=axes[1])
update_style(ax=axes[0])
update_style(ax=axes[1])
axes[1].get_images()[1].set_alpha(0.2)
plot1d(result=res1d_horizontal, ax=axes[2])
axes[1].set_title("Integration patch")
axes[2].set_title("qIP-integration");
APIs for integrate1d using the exit angles and polar angles#
integrate1d_polar: intensity profile as a function of the polar angle (or inverse, integrate a polar angle sector as a function of q)integrate1d_exitangles: intensity profile along a specific exit angle (horizontal or vertical)
sample_orientation=6
res2d_polar_1 = fi.integrate2d_polar(data=data, sample_orientation=sample_orientation)
res2d_polar_2 = fi.integrate2d_polar(data=data, sample_orientation=sample_orientation,
                                     polar_degrees=False, radial_unit="A^-1", radial_integration=True,
                                     )
res2d_exitangle_1 = fi.integrate2d_exitangles(data=data, sample_orientation=sample_orientation, incident_angle=0.0,
                                              npt_oop=1000, npt_ip=1000,
                                              )
res2d_exitangle_2 = fi.integrate2d_exitangles(data=data, sample_orientation=sample_orientation, incident_angle=0.0,
                                              npt_oop=1000, npt_ip=1000, angle_degrees=False,
                                              )


res1d_polar_1 = fi.integrate1d_polar(data=data, sample_orientation=sample_orientation,
                                     npt_oop=500, npt_ip=500,
                                     )
res1d_polar_2 = fi.integrate1d_polar(data=data, sample_orientation=sample_orientation,
                                     npt_oop=500, npt_ip=500,
                                     polar_degrees=False, radial_unit="A^-1", radial_integration=True,
                                     )
res1d_exitangle_1 = fi.integrate1d_exitangles(data=data,
                                              npt_oop=1000, npt_ip=1000,
                                              sample_orientation=sample_orientation, incident_angle=0.0)

res1d_exitangle_2 = fi.integrate1d_exitangles(data=data, npt_oop=1000, npt_ip=1000,
                                              angle_degrees=False,
                                              sample_orientation=sample_orientation, incident_angle=0.0)


fig, axes = subplots(ncols=4, nrows=2, figsize=(20,10))
plot2d(result=res2d_polar_1, ax=axes[0,0])
plot2d(result=res2d_polar_2, ax=axes[0,1])
plot2d(result=res2d_exitangle_1, ax=axes[0,2])
plot2d(result=res2d_exitangle_2, ax=axes[0,3])

plot1d(result=res1d_polar_1, ax=axes[1,0])
plot1d(result=res1d_polar_2, ax=axes[1,1])
plot1d(result=res1d_exitangle_1, ax=axes[1,2])
plot1d(result=res1d_exitangle_2, ax=axes[1,3])
for ax in axes.ravel():
    update_style(ax=ax);
How to enable pixel-splitting in FiberIntegrator#
For AzimuthalIntegrator, integration methods use
bboxpixel splitting scheme by defaultFor integrate2d/integrate1d_grazing_incidence methods, the default pixel splitting scheme is set to
no
res2d_no = fi.integrate2d_grazing_incidence(data=data, sample_orientation=6, incident_angle=numpy.deg2rad(0.12))
res2d_bbox = fi.integrate2d_grazing_incidence(data=data, sample_orientation=6, incident_angle=numpy.deg2rad(0.12),
                                              method=("bbox", "csr", "cython")
                                             )


fig, axes = subplots(ncols=2, figsize=(10,5))
plot2d(result=res2d_no, ax=axes[0])
plot2d(result=res2d_bbox, ax=axes[1])
update_style(ax=axes[0])
update_style(ax=axes[1])
axes[0].set_title("Pixel-splitting=no")
axes[1].set_title("Pixel-splitting=bbox");
WARNING:pyFAI.geometry.core:No fast path for space: `qip`
WARNING:pyFAI.geometry.core:No fast path for space: `qoop`
WARNING:pyFAI.integrator.fiber:
                           Method ('bbox', 'csr', 'cython') is using a pixel-splitting scheme without the missing wedge mask.
                           Either set use_missing_wedge=True or do not use pixel-splitting.
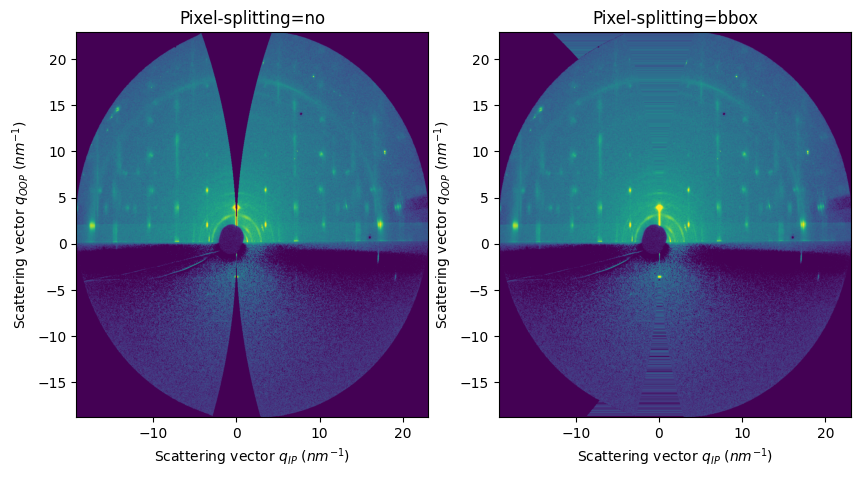
#
During the integration, the pixel splitting scheme associate intensity values to the missing wedge
Switching off the pixel splitting solves the problem, but may create oversampling effect
How to mask the missing wedge#
After version 2025.6, pyFAI allows to mask out the missing wedge intensity values.
The mask contains the local distribution of pixels with the lowest number of counts (presumably those pixels artificially filled due to the pixel splitting scheme)
Warning: this feature is experimental, should be use with caution and only in the following situations:
For integrate1d_grazing_incidence, if the sector to integrate overlaps with the missing wedge and the result is oversampled.
The same logics for integrate2d_grazing_incidence, although in these results, oversampling is less critical.
Result in 2D to visualize, from which we will perform a horizontal integration (I vs qip)
result_2d = fi.integrate2d_grazing_incidence(data=data, sample_orientation=6,
                                             oop_range=[5.5,6.25], ip_range=[-7,7],
                                             npt_ip=1000, npt_oop=10,
)
Default result without pixel splitting
result_1d_no_split = fi.integrate1d_grazing_incidence(data=data, sample_orientation=6,
                                                      oop_range=[5.5,6.25], ip_range=[-7,7],
                                                      npt_ip=1000, npt_oop=100,
                                                      vertical_integration=False,
)
Result using bbox pixel splitting
result_1d_bbox_split = fi.integrate1d_grazing_incidence(data=data, sample_orientation=6,
                                                      oop_range=[5.5,6.25], ip_range=[-7,7],
                                                      npt_ip=1000, npt_oop=100,
                                                      vertical_integration=False,
                                                      method=("bbox", "csr", "cython"),
)
WARNING:pyFAI.integrator.fiber:Method ('bbox', 'csr', 'cython') is using a pixel-splitting scheme. GI integration should be use WITHOUT PIXEL-SPLITTING! The results could be wrong!
WARNING:pyFAI.geometry.core:No fast path for space: `qip`
WARNING:pyFAI.geometry.core:No fast path for space: `qoop`
WARNING:pyFAI.integrator.fiber:
                           Method ('bbox', 'csr', 'cython') is using a pixel-splitting scheme without the missing wedge mask.
                           Either set use_missing_wedge=True or do not use pixel-splitting.
fig, axes = subplots(ncols=3, figsize=(15,5))
plot2d(result=result_2d, ax=axes[0])
plot1d(result=result_1d_no_split, ax=axes[1])
plot1d(result=result_1d_bbox_split, ax=axes[2])
for ax in axes:
    update_style(ax=ax)
axes[0].set_title("2D patch")
axes[1].set_title("Pixel-splitting=no")
axes[2].set_title("Pixel-splitting=bbox");
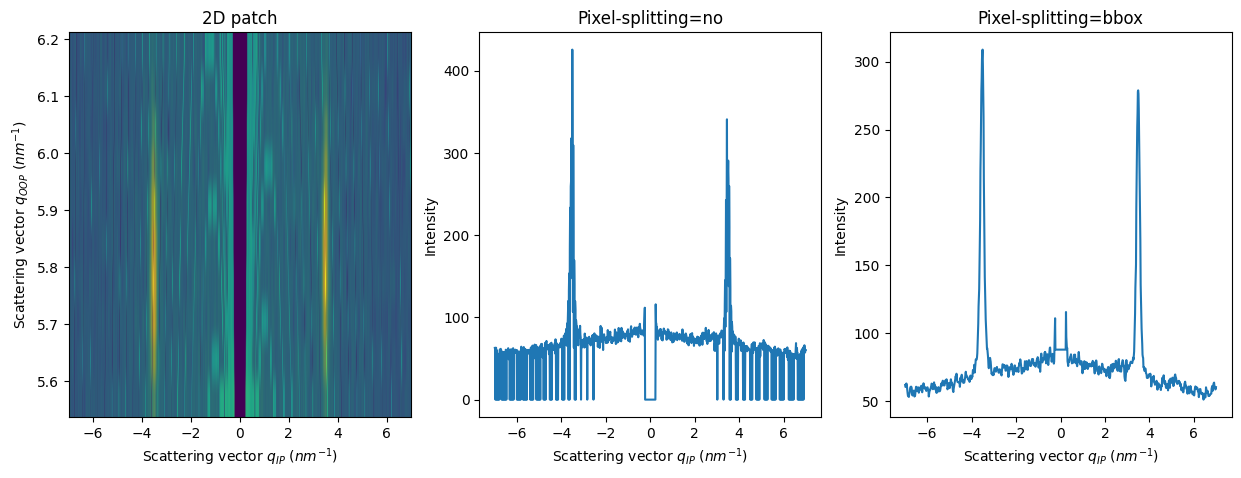
Integration without pixel splitting takes into account the missing wedge but the result is oversampled due to npt_ip=1000
Integration with pixel splitting looks better but the gap at qip=0 is smoothed as well
result_1d_no_split_lowres = fi.integrate1d_grazing_incidence(data=data, sample_orientation=6,
                                                      oop_range=[5.5,6.25], ip_range=[-7,7],
                                                      npt_ip=100, npt_oop=100,
                                                      vertical_integration=False,
)
result_1d_bbox_split_masked = fi.integrate1d_grazing_incidence(data=data, sample_orientation=6,
                                                               oop_range=[5.5,6.25], ip_range=[-7,7],
                                                               npt_ip=1000, npt_oop=100,
                                                               vertical_integration=False,
                                                               method=("bbox", "csr", "cython"),
                                                               mask_missing_wedge=True,
)
WARNING:pyFAI.integrator.fiber:Method ('bbox', 'csr', 'cython') is using a pixel-splitting scheme. GI integration should be use WITHOUT PIXEL-SPLITTING! The results could be wrong!
WARNING:pyFAI.integrator.fiber:
                           Method ('bbox', 'csr', 'cython') is using a pixel-splitting scheme without the missing wedge mask.
                           Either set use_missing_wedge=True or do not use pixel-splitting.
fig, axes = subplots(ncols=3, figsize=(15,5))
plot2d(result=result_2d, ax=axes[0])
plot1d(result=result_1d_no_split, ax=axes[1], label="npt_ip=1000")
plot1d(result=result_1d_no_split_lowres, ax=axes[1], label="npt_ip=100")
plot1d(result=result_1d_bbox_split_masked, ax=axes[2], label="masked")
plot1d(result=result_1d_bbox_split, ax=axes[2], label="non-masked")
for ax in axes:
    update_style(ax=ax)
axes[0].set_title("2D patch")
axes[1].set_title("Pixel-splitting=no, low-resolution")
axes[2].set_title("Pixel-splitting=full, masked");
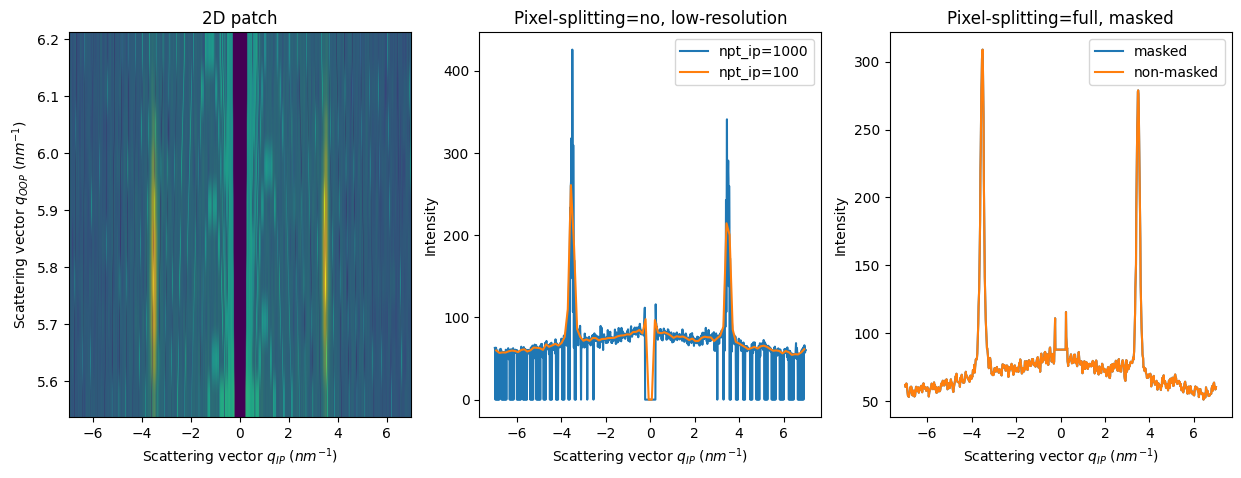
To get a smooth integrated curve while masking the missing wedge:#
fi.integrate1d_grazing_incidence(**kwargs, method=(“bbox”, “csr”, “cython”), mask_missing_wedge=True)
Why the missing wedge?#
The missing wedge appears when we represent the qz component versus the in-plane q component.
With a static geometry, we can only prove a spherical shell of the whole reciprocal space of the sample.
Every point of that shell is in “Bragg condition”; we call that shell the Ewald sphere.
What we see in the detector is the projection of the Ewald sphere into the surface of the detector.
We can represent that data in terms of the exit angles (horizontal and vertical)
But if we represent it with the units qoop-qip, we will see how a sphere can only intersect a rod in 1 or 2 points.
If
incident_angle=0.0, the only point of qoop in Bragg conditions is qoop=0If
incident_angle!=0.0, there are two points in Bragg conditions: qoop=0 and qoop=incident_angle, which is the reflected beam.
res2d_0 = fi.integrate2d_grazing_incidence(data=data, sample_orientation=6, incident_angle=0.0)
res2d_01rad = fi.integrate2d_grazing_incidence(data=data, sample_orientation=6, incident_angle=0.1)

fig, axes = subplots(ncols=3, figsize=(15,5))
plot2d(result=res2d_0, ax=axes[0])
plot2d(result=res2d_01rad, ax=axes[1])
plot2d(result=res2d_01rad, ax=axes[2])
update_style(ax=axes[0])
update_style(ax=axes[1])
update_style(ax=axes[2])
axes[2].set_xlim(-2,2)
axes[2].set_ylim(10,15)
axes[0].set_title("0.0 rad")
axes[1].set_title("0.1 rad")
axes[2].set_title("0.1 rad_zoom");
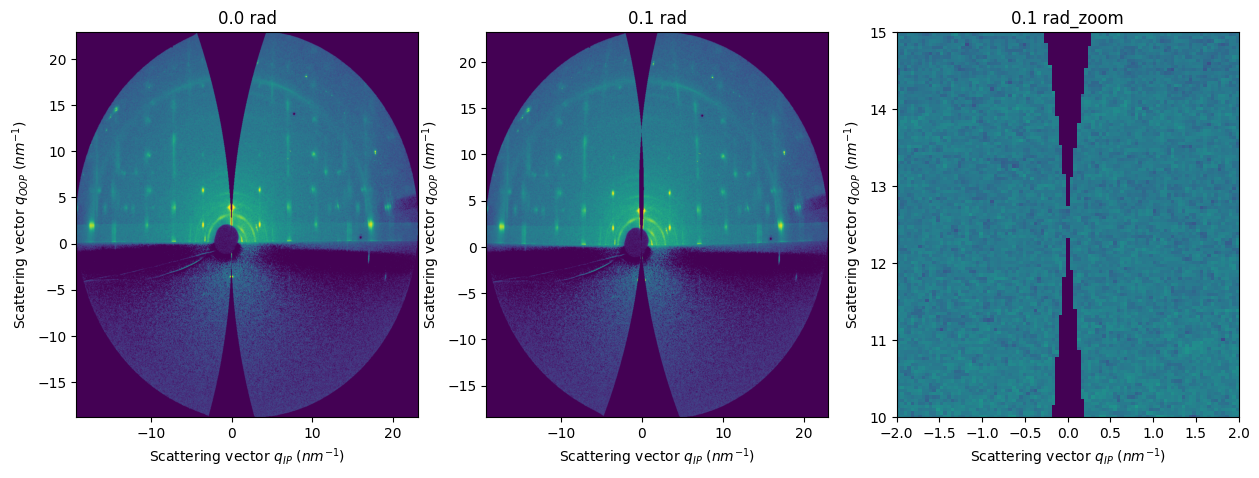
incident_angle = 0.1
q_bragg = 4 * numpy.pi / fi.wavelength * numpy.sin(2 * incident_angle / 2) / 1e9
print(f"Along qoop, we only prove 0.0nm^-1 and {q_bragg:.2f} nm^-1")
Along qoop, we only prove 0.0nm^-1 and 12.55 nm^-1
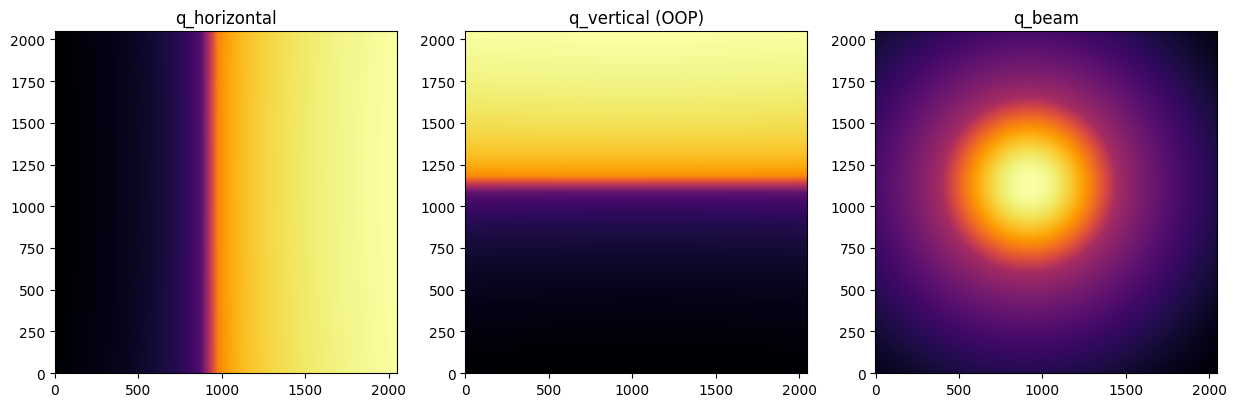
The missing wedge appears because we represent the surface of a sphere (Ewald) as a function of one of the 3D axis (qOOP = qVertical)#
The same way, we get a missing wedge in the horizontal axis if we plot data as a function of (Qxz - Qy)
fig, axes = plt.subplots(ncols=3, figsize=(15,5))
arr_qx = fi.array_from_unit(unit=get_unit_fiber("qxgi_nm^-1"))
arr_qy = fi.array_from_unit(unit=get_unit_fiber("qygi_nm^-1"))
arr_qz = fi.array_from_unit(unit=get_unit_fiber("qzgi_nm^-1"))
display(arr_qx, ax=axes[0], label="q_horizontal")
display(arr_qy, ax=axes[1], label="q_vertical (OOP)")
display(arr_qz, ax=axes[2], label="q_beam");
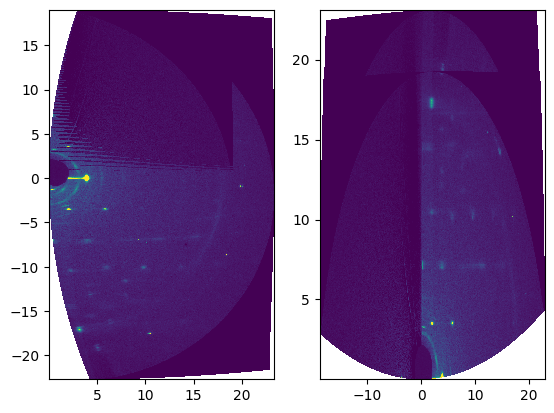
fig, ax = plt.subplots(ncols=2)
arr_qx = fi.array_from_unit(unit=get_unit_fiber("qxgi_nm^-1"))
arr_qy = fi.array_from_unit(unit=get_unit_fiber("qygi_nm^-1"))
arr_qz = fi.array_from_unit(unit=get_unit_fiber("qzgi_nm^-1"))
arr_qxy = numpy.sqrt(arr_qx ** 2 + arr_qy ** 2)
arr_qxz = numpy.sqrt(arr_qx ** 2 + arr_qz ** 2)
arr_qyz = numpy.sqrt(arr_qy ** 2 + arr_qz ** 2)
ax[0].pcolormesh(arr_qxz, arr_qy, data, vmin=0, vmax=500)
ax[1].pcolormesh(arr_qx, arr_qyz, data, vmin=0, vmax=500);
/tmp/ipykernel_156369/3644057874.py:8: UserWarning: The input coordinates to pcolormesh are interpreted as cell centers, but are not monotonically increasing or decreasing. This may lead to incorrectly calculated cell edges, in which case, please supply explicit cell edges to pcolormesh.
  ax[0].pcolormesh(arr_qxz, arr_qy, data, vmin=0, vmax=500)
/tmp/ipykernel_156369/3644057874.py:9: UserWarning: The input coordinates to pcolormesh are interpreted as cell centers, but are not monotonically increasing or decreasing. This may lead to incorrectly calculated cell edges, in which case, please supply explicit cell edges to pcolormesh.
  ax[1].pcolormesh(arr_qx, arr_qyz, data, vmin=0, vmax=500);
print(f"Total run-time: {time.perf_counter()-t0:.3f}s")
Total run-time: 34.984s
Conclusions#
PyFAI provides a simple API to represent a data array as a function of in-plane and out-of-plane components of vector q.
This is a standard way to display GIWAXS/GISAXS or fiber diffraction patterns.
New parameters to take into account:
sample_orientationincident_angletilt_angle
Other possible new coordinates:
exit_angle_vertvsexit_angle_horzpolar_anglevsqtot